
New in Dentrix G7.8, the Dentrix Reports module offers a wide variety of clear, concise, and uniform reporting for your practice’s success!
There is a lot of information out there for a busy office manager to keep track of. That information could help you answer some key questions:
- Are you keeping up with collecting on accounts?
- Are new patients being recorded and rescheduled?
- Which insurance carriers are paying you in a timely manner?
- Are you scheduling your providers efficiently?
Fortunately, Dentrix G7.8 includes the new Dentrix Reports module. Dentrix Reports offers reporting and analysis on these and other topics to help you understand the complexities of your practice so you can make more informed decisions. The reports are presented in a clean, consistent, and easy-to-read format.
Accessing Dentrix Reports
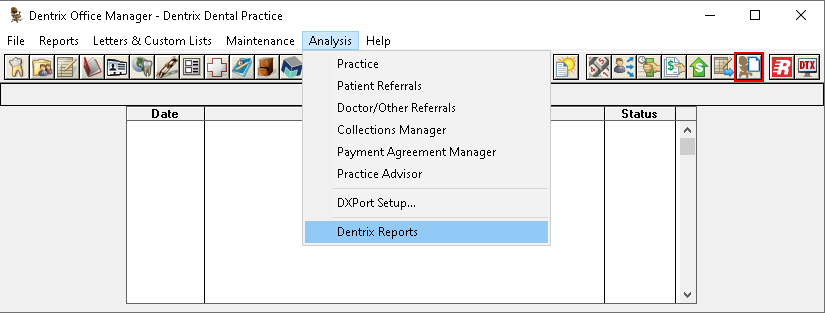
To access Dentrix Reports, from the Analysis menu in Office Manager, click Dentrix Reports, or click the Dentrix Reports button on the toolbar.
The Dentrix Reports Window
The Dentrix Reports window is divided into three sections.
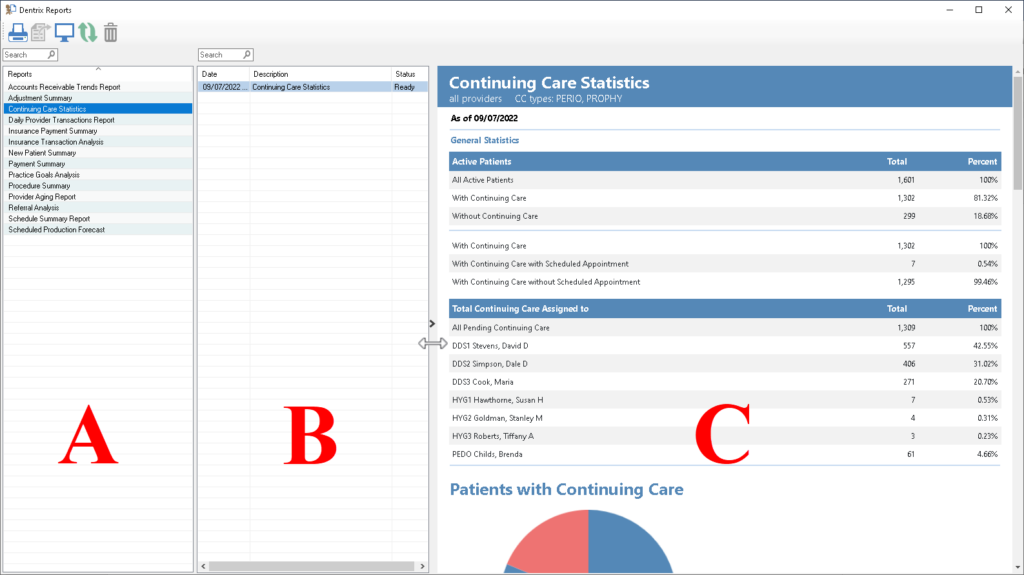
In the left section (A), double-click a report to reveal the options for that report.
After selecting the report options, the generated report will be listed in the second section (B) with the current date and status.
The right section (C) provides an on-screen preview of the report selected in the second section. You can optionally turn this preview section on or off using the Hide/Show Preview button.
You can resize these sections too. Position your mouse on the dividers between the sections and drag the divider left or right.
While previewing a report, press the End key on your keyboard to skip to the bottom of the report, or the Home key to return to the top.
Report Options
Each report has a different function and purpose, so the options vary between them. But all reports feature some standardized tools for selecting options.
Selecting from Lists
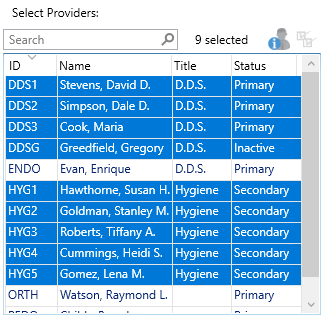
When the report allows you to select from a list (such as a list of providers or billing types), you’ll see a button above the list that you can click to select the entire list. Click the button a second time to select only the first item on the list.
When selecting from a list, you can select multiple items. If the items are not in sequence, hold the Control key on your keyboard while you click each individual item you want to select. If the items are listed consecutively in the list, click the first selection and hold down the SHIFT key on your keyboard while you click the last item, and all options from the first to the last selection will be selected.
Above each list is a search bar. Type the search text in the search bar to narrow down the results list, making it easier to find specific items in long lists.
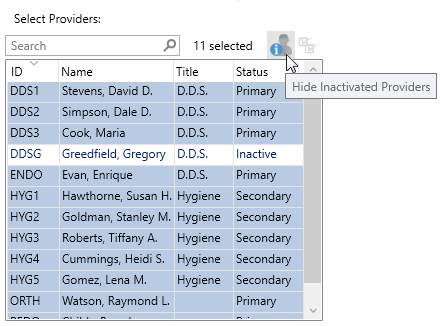
Provider Lists
When selecting from a list of providers, look for the button at the upper-right that will Show or Hide Inactive Providers.
Dates
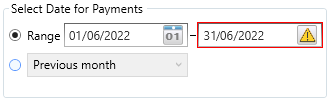
Reports options will let you quickly choose a specific date or date range or enter an exact date or date range.
Depending on the report’s purpose, you may be restricted to using only past or future dates. A warning icon will appear if you have made an improper selection. (You can hover your mouse pointer over the icon to display the reason for the warning).
Entry Date or Procedure Date
Many reports have the option to show transactions according to Entry Date or Procedure Date. In the report options, under Transactions By, select the date type that Dentrix will use to fill in the information and calculate totals on the report.
When you enter procedures, payments, or adjustments, the day that you save the transaction is recorded as the Entry Date. If you change the date of a procedure, payment, or adjustment, you are changing the Procedure Date. Since most transactions are entered on the same day that they are completed, the Entry Date and Procedure Date are often the same. It can be useful for administrators to compare an entry dated report to a procedure dated report to determine if there is a lot of unusual activity surrounding the changing of transaction dates.
Save Options
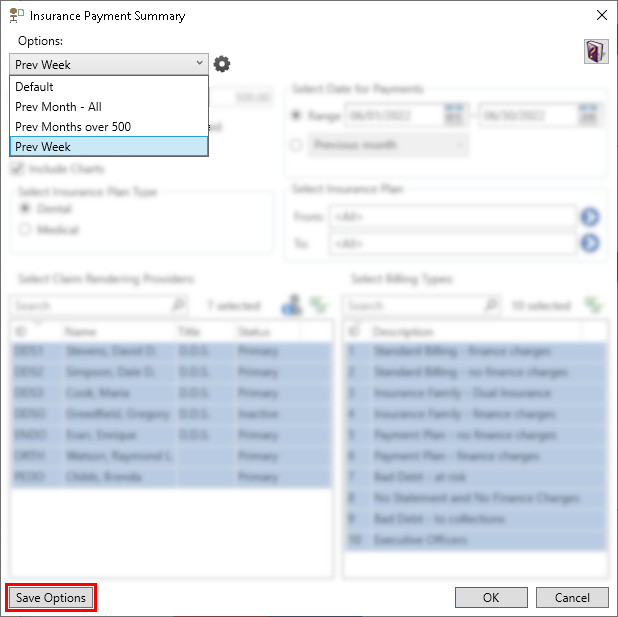
As you make selections, you may want to reuse the same options when you run the report in the future. Each report features the ability to save the selected options as a template. Click the Save Options button at the lower-left corner. Assign a name to the set of options so that you can recognize this template for future use.
At the top-left of every report is an Options menu where you can select any of the saved templates, even those created at a different computer.
Next to that menu is a Setup gear icon. Click this button to rename or delete saved report templates.
Shared Report Features
Each Dentrix Report shares some common features and styles for a consistent reading experience.
Report Header
The header of each report will contain the report name, whether the report is using entry or procedure dates, which providers are included, and which billing types are included (when applicable to the report). As you review different copies of the same report, this will give you a quick way to remember the options selected and ensure that you are comparing similar information.

Charts or Graphs
Most reports include an option to depict the information as a chart or graph. These graphs give you a quick overview and an easy-to-digest understanding of the information. When selected, these graphs appear at the end of the report.
While previewing a report, click the Print button to print a copy.

Export
While previewing a report, click the Export button to save a PDF copy.

The Reports
There are 14 reports available in Dentrix G7.8, covering a variety of topics.
1. Daily Provider Transactions Report
The Daily Provider Transactions Report shows all completed procedures, payments, and adjustments for the day, sorted by the assigned provider. Practices with several providers will benefit by being able to see transactions grouped under the provider ID.
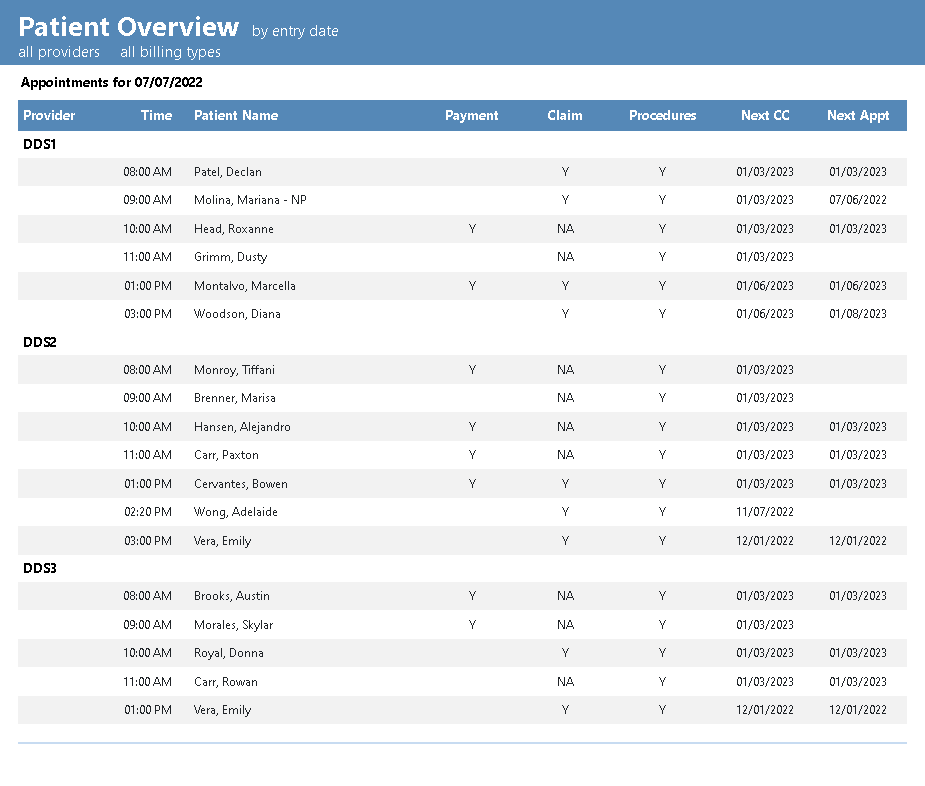
Within the Daily Provider Transactions Report options, you can create a separate Patient Overview report. This report shows which of today’s patients made payments, created claims, or posted procedures. It also shows their next continuing care due date and their next scheduled appointment date. At a glance you’ll be able to identify your team’s follow-through with today’s appointed patients.
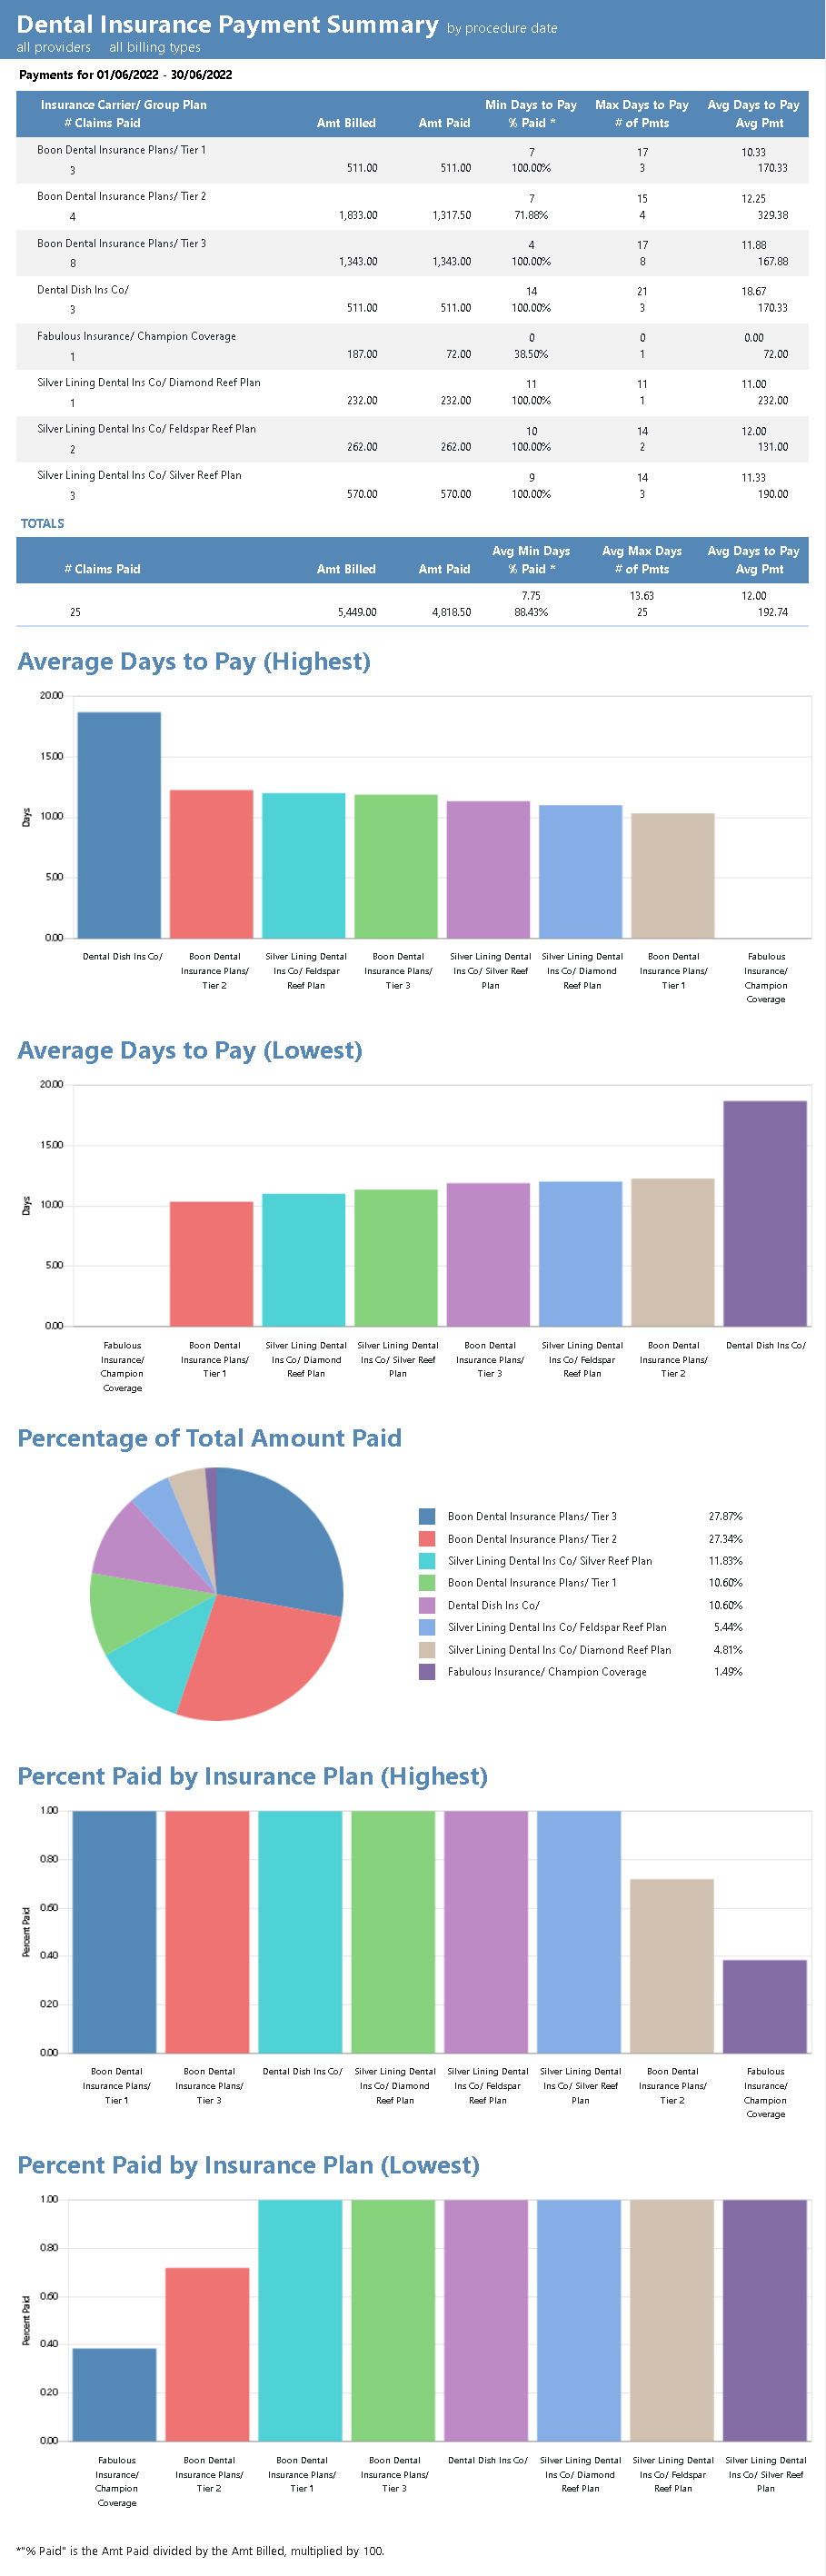
2. Insurance Payment Summary
The Insurance Payment Summary gives you a comparison of the amount billed versus the amount paid per insurance group. You’ll learn how many insurance payments were received within a date range and how many days the plan takes to pay its claims. This information can highlight potential opportunities to merge or purge plans from your practice.
3. Insurance Transaction Analysis
The Insurance Transaction Analysis Report provides a comprehensive itemization of claims sent for each carrier. Under each carrier, you can change the level of detail displayed, from only viewing the totals for each plan, seeing the patients with claims, or viewing the full detail of the procedures and payments belonging to each claim. This report provides a good way to understand which insurance plans your office used within the time period.
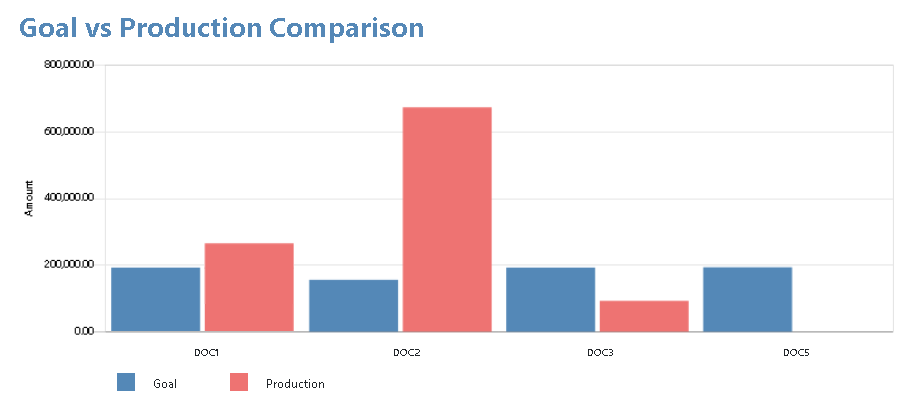
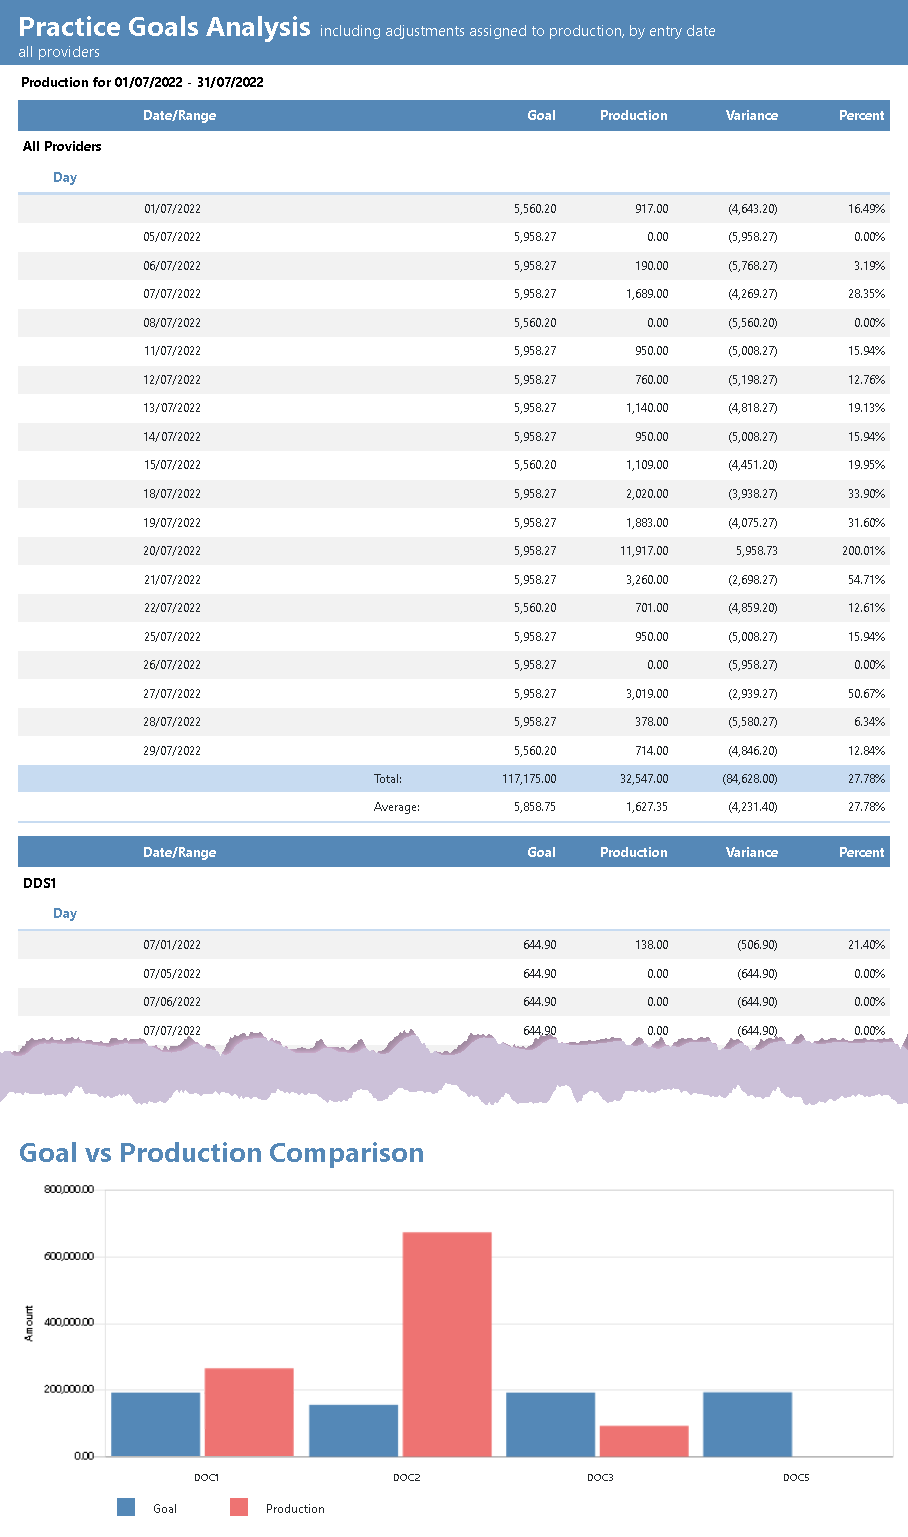
4. Practice Goals Analysis
The Practice Goals Analysis Report displays how each of your providers performed by comparing their actual production to the practice’s goals. The detail can be displayed on a daily, weekly, monthly, or yearly basis, letting you know which of your providers are hitting their benchmarks.
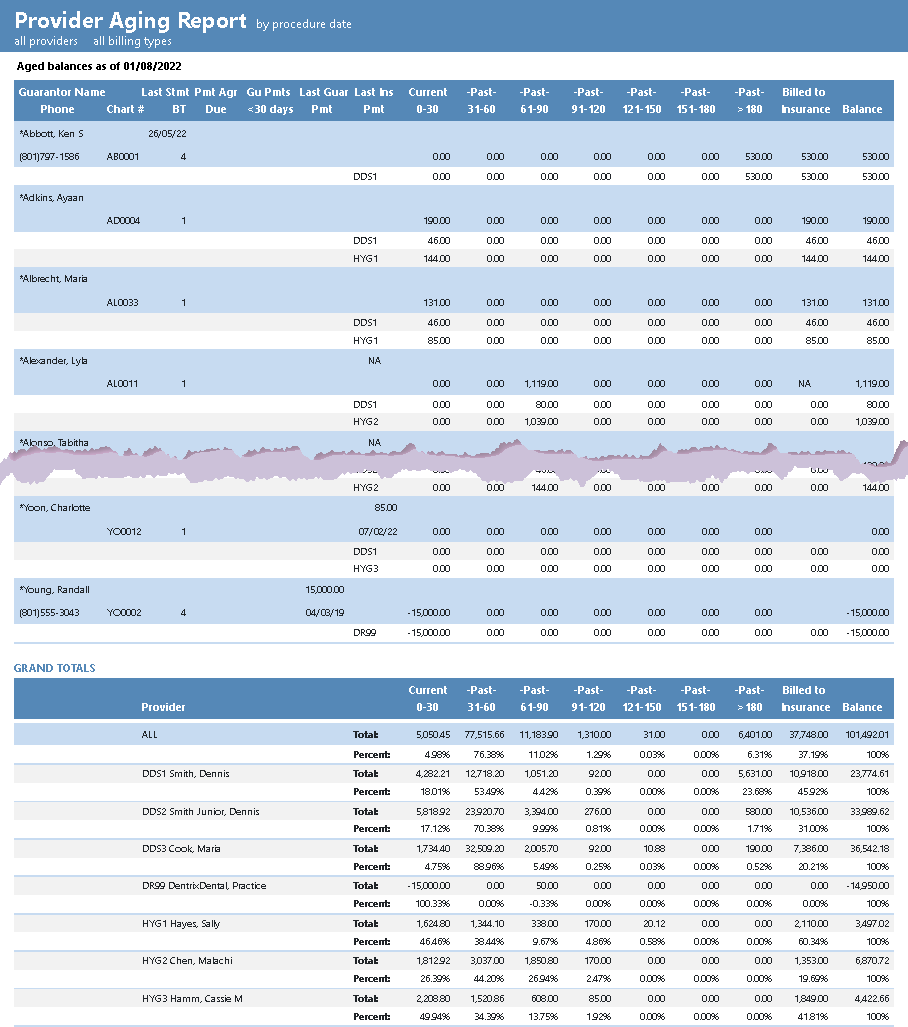
5. Provider Aging Report
The Provider Aging Report lets you view the balances owed to each provider (unlike the traditional Aging Report or the Collection Manager which offer sorting based on the guarantor’s assigned provider). You have options to view this report by family or by patient. It also displays balances in aging brackets ranging up to 180 days old.
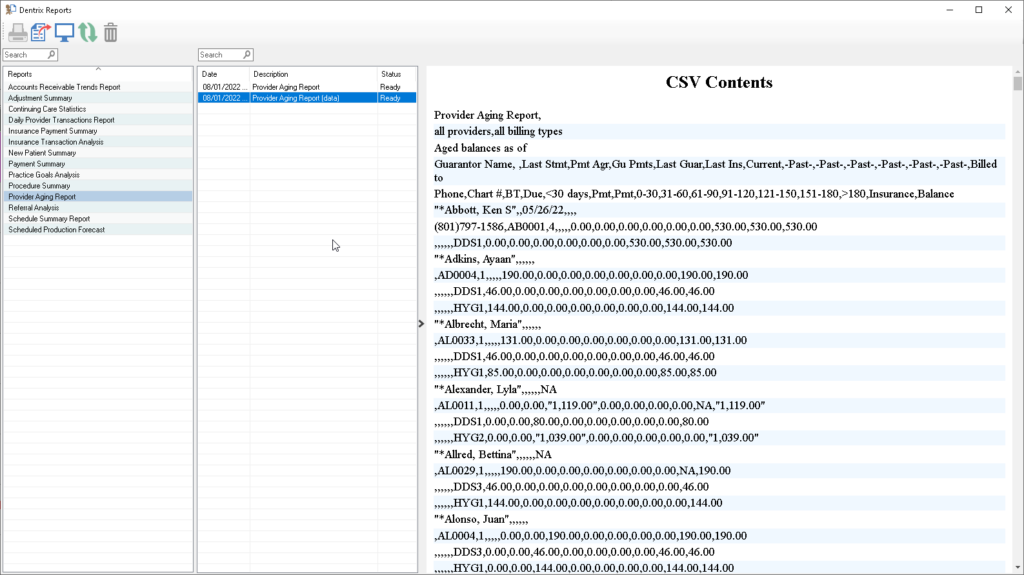
Within the Provider Aging options, the Generate Data File for Export option allows this information to be exported as a spreadsheet. To create the spreadsheet for this, preview the report data and then click the Export button. You will then see a Save As window where you can save the report to a CSV file that can be opened in any spreadsheet application.
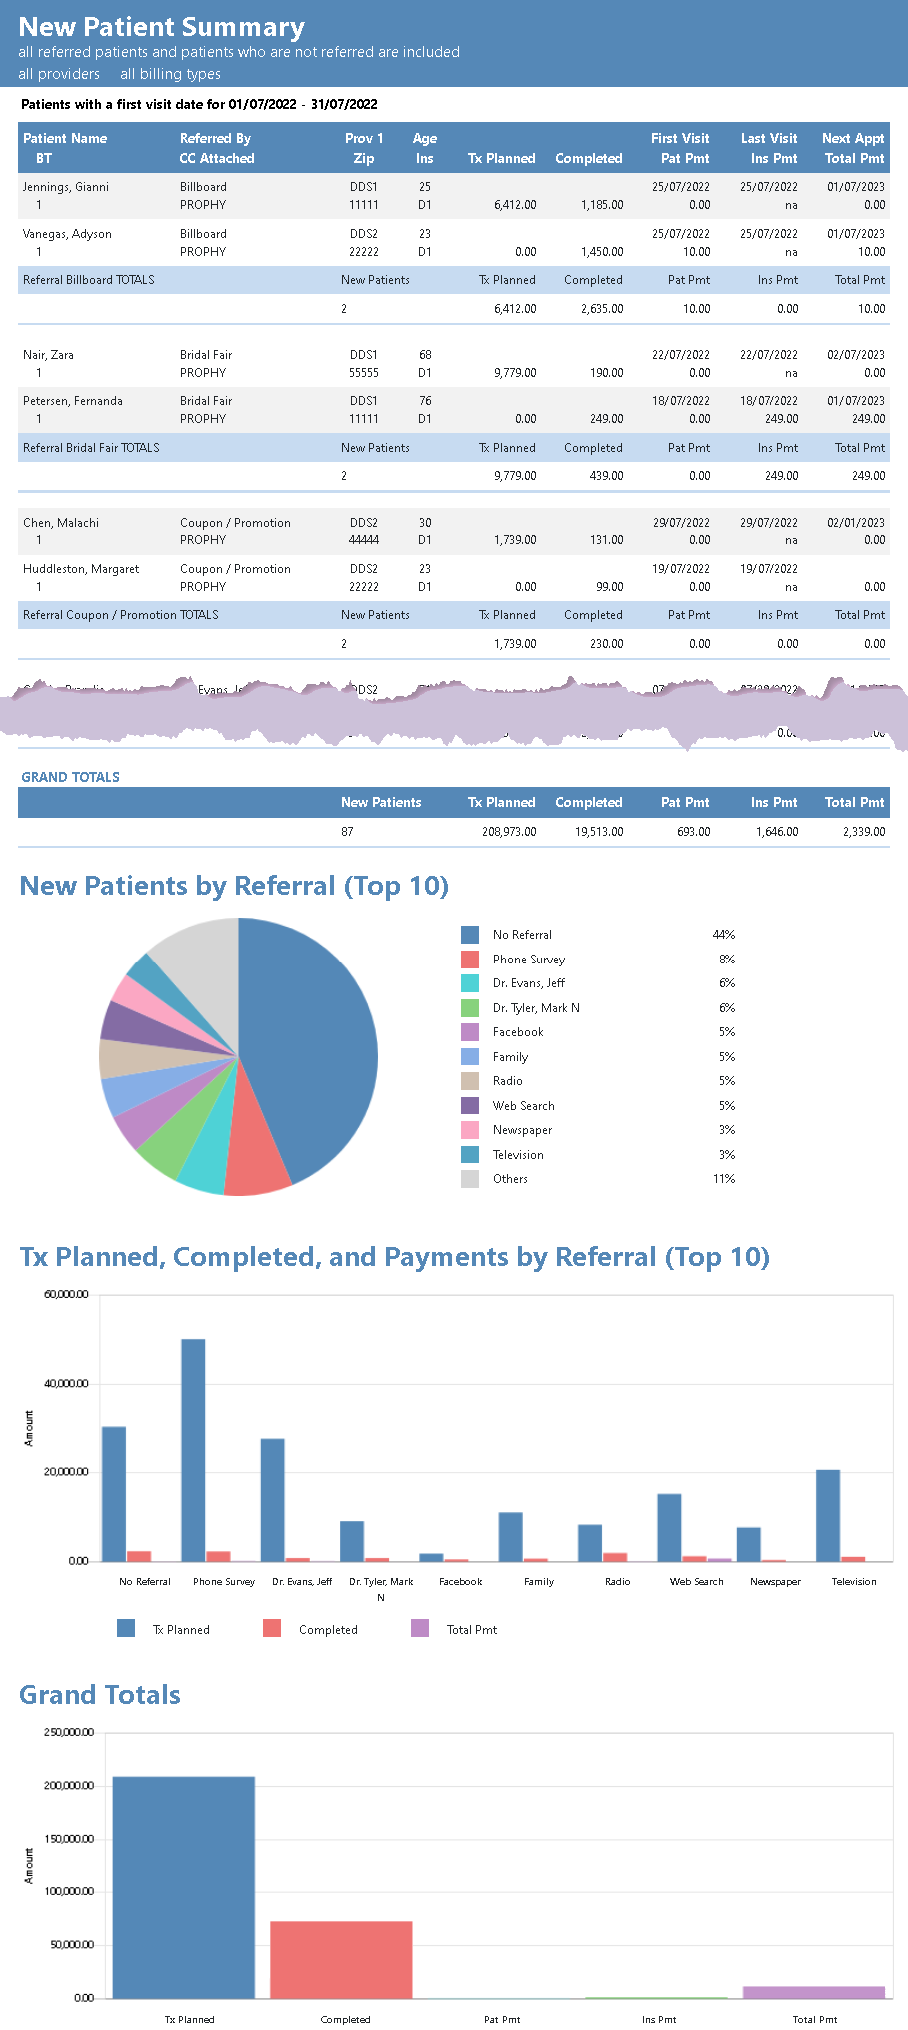
6. New Patient Summary
You work hard to attract new patients, and the New Patient Summary Report will help you understand how effectively your team managed these individuals! You can learn if the team entered a billing type and a referral source, what Continuing Care types were assigned to these patients, and the ages and ZIP code(s) your new patients are coming from. You may discover there is an opportunity to focus more advertising on those ZIP codes and age groups! You can learn if new patients have dental or medical insurance, how much production was charged, and how much collection came from the patient versus the insurance plan.
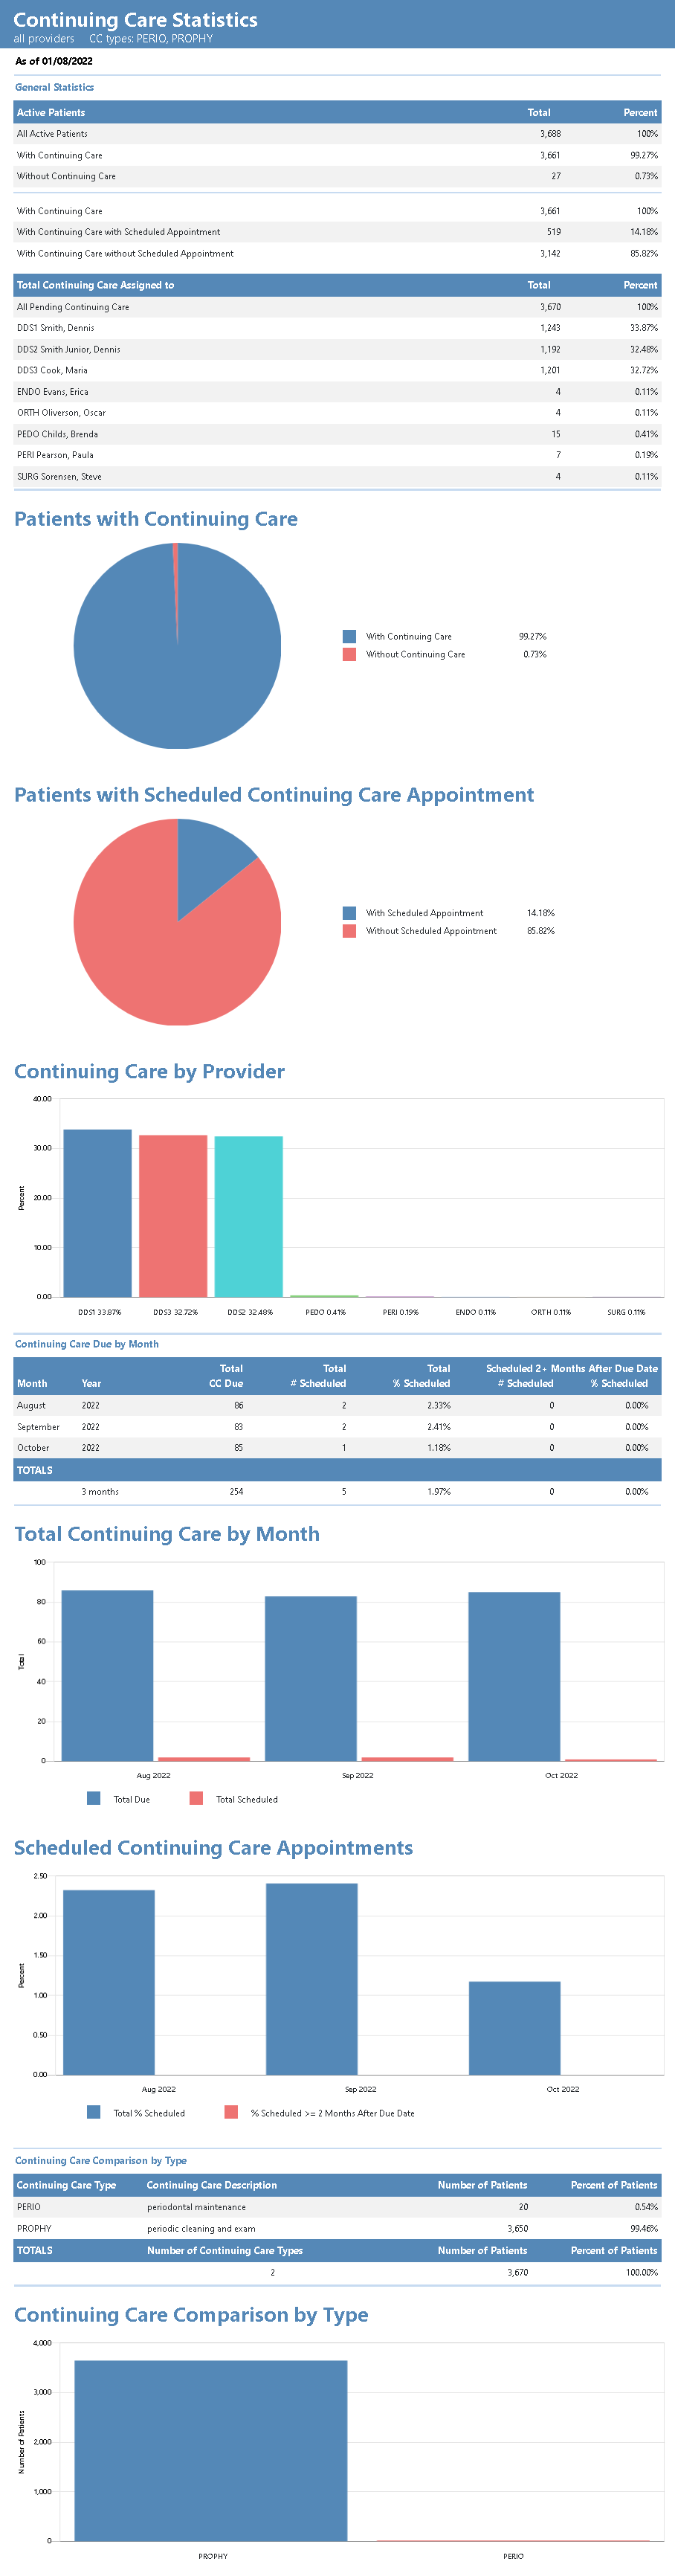
7. Continuing Care Statistics
Keeping patients coming back is critical for your success. The Continuing Care Statistics Report brings together general statistics for your practice, such as how many patients are attached to Continuing Care, the number of patients that are due versus scheduled, and the number of patients attached to each continuing care type. This information can help you evaluate your different Continuing Care types and see which ones are most effective. If there are months that you are expecting fewer patients to return, look for opportunities to reactivate and welcome back patients to help fill those lulls.
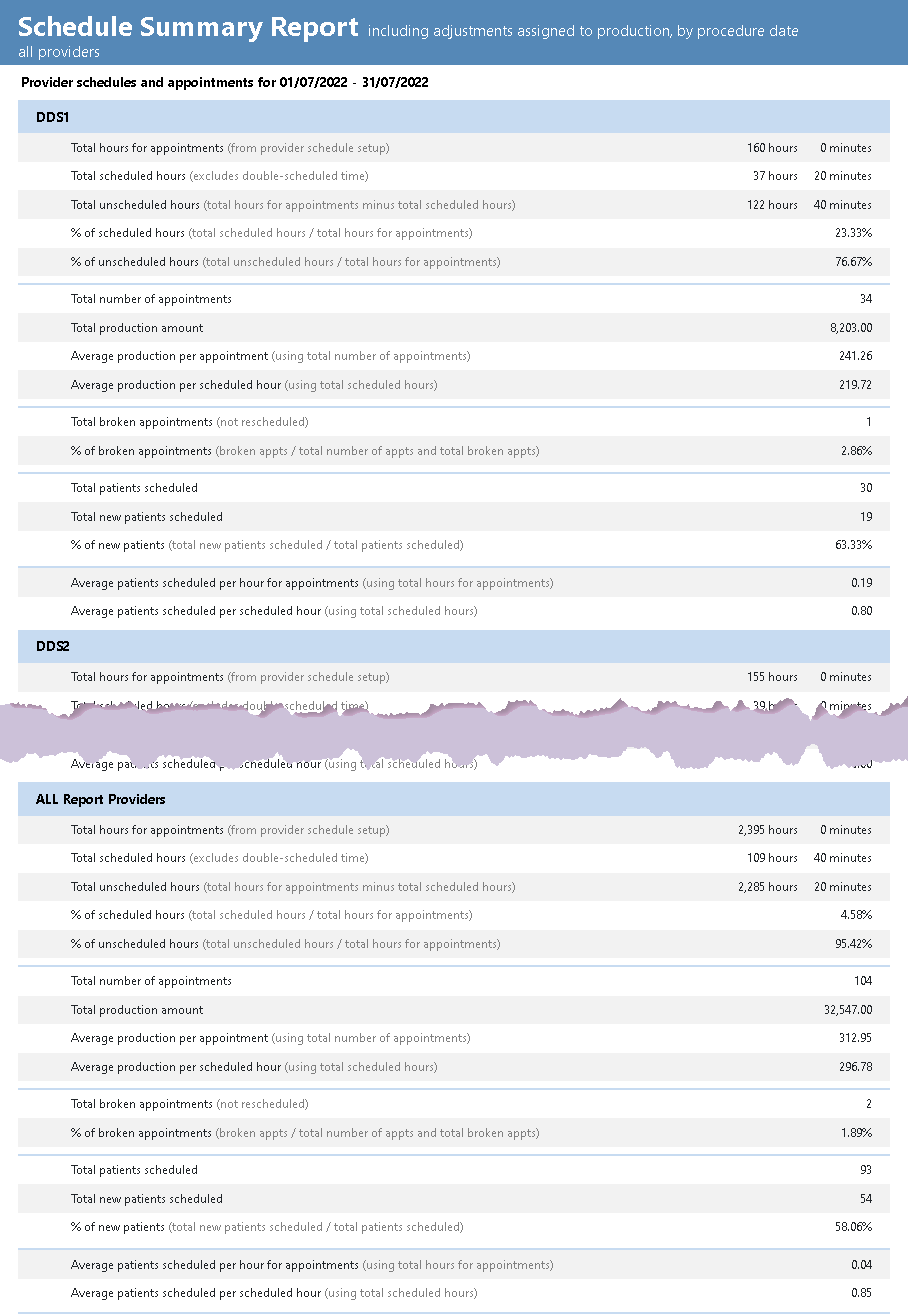
8. Schedule Summary Report
The Schedule Summary Report provides you with vital statistics regarding the effectiveness of your scheduling. From this report you will learn how many appointments you scheduled and the production value of those appointments, how many broken appointments were not rescheduled, how many patients were scheduled, and how many unfilled hours were on your schedule.
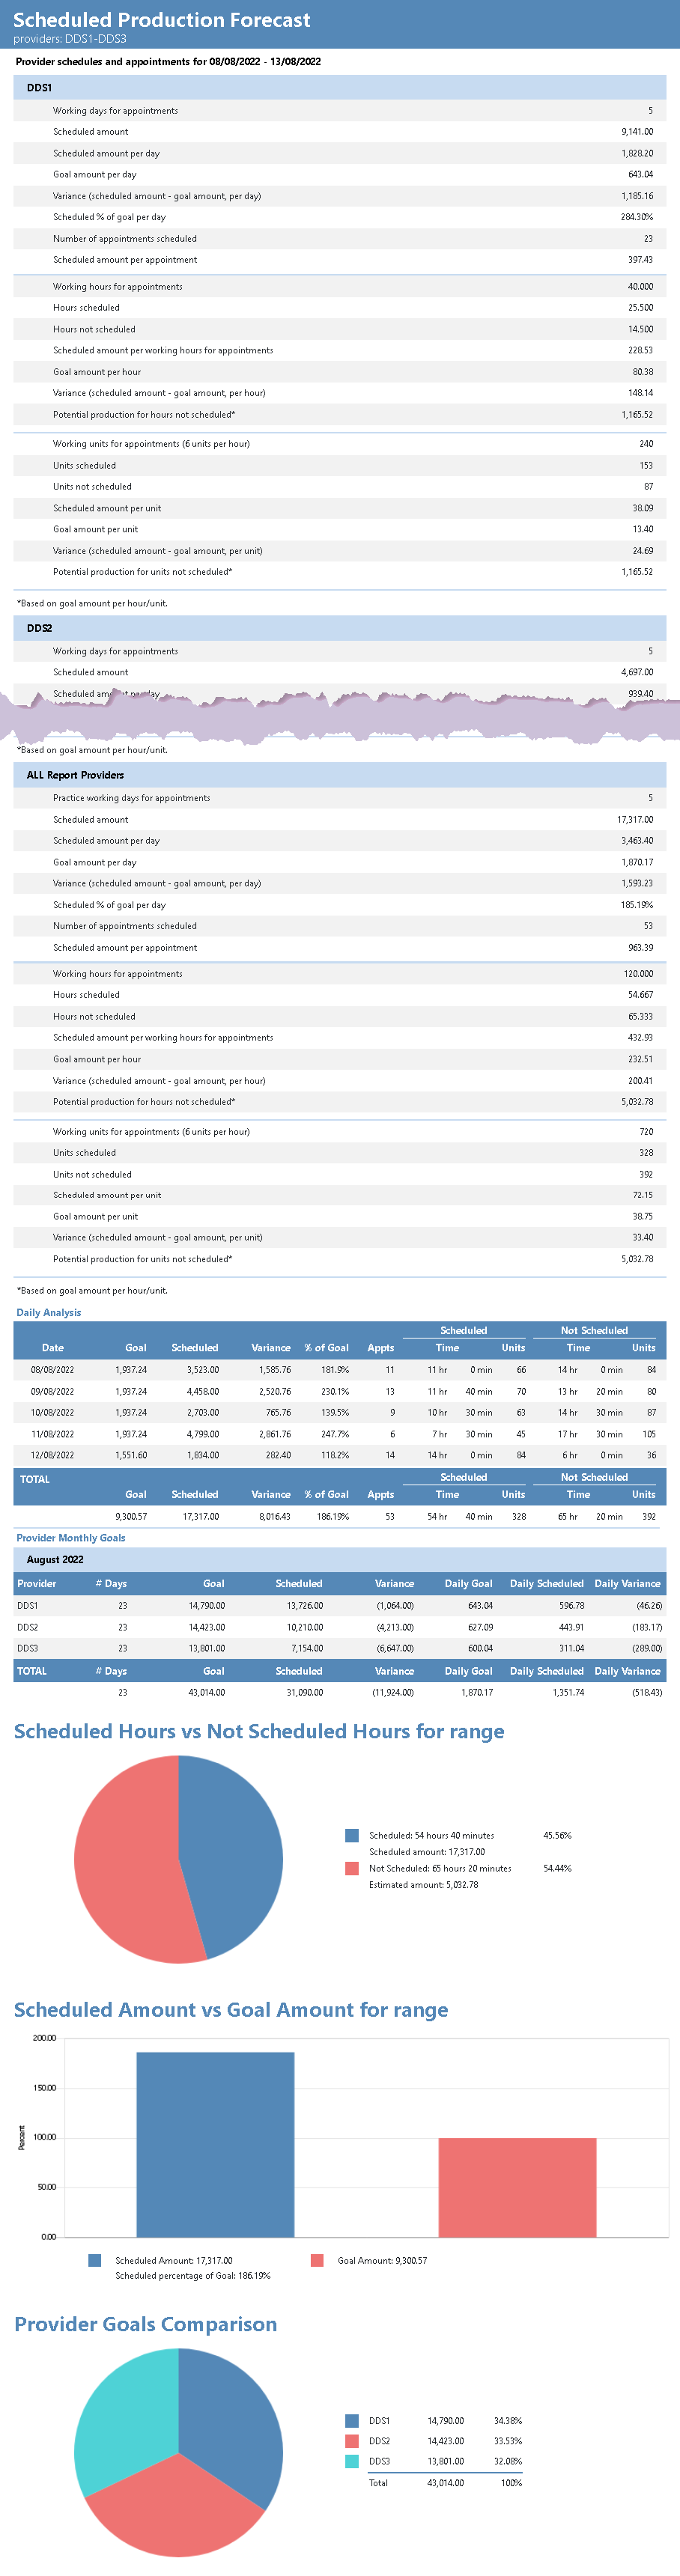
9. Scheduled Production Forecast
The Scheduled Production Forecast allows you to preview future working days, patients scheduled, and unfilled hours. It is a great place to see how your upcoming days look in comparison to the practice’s production goals.
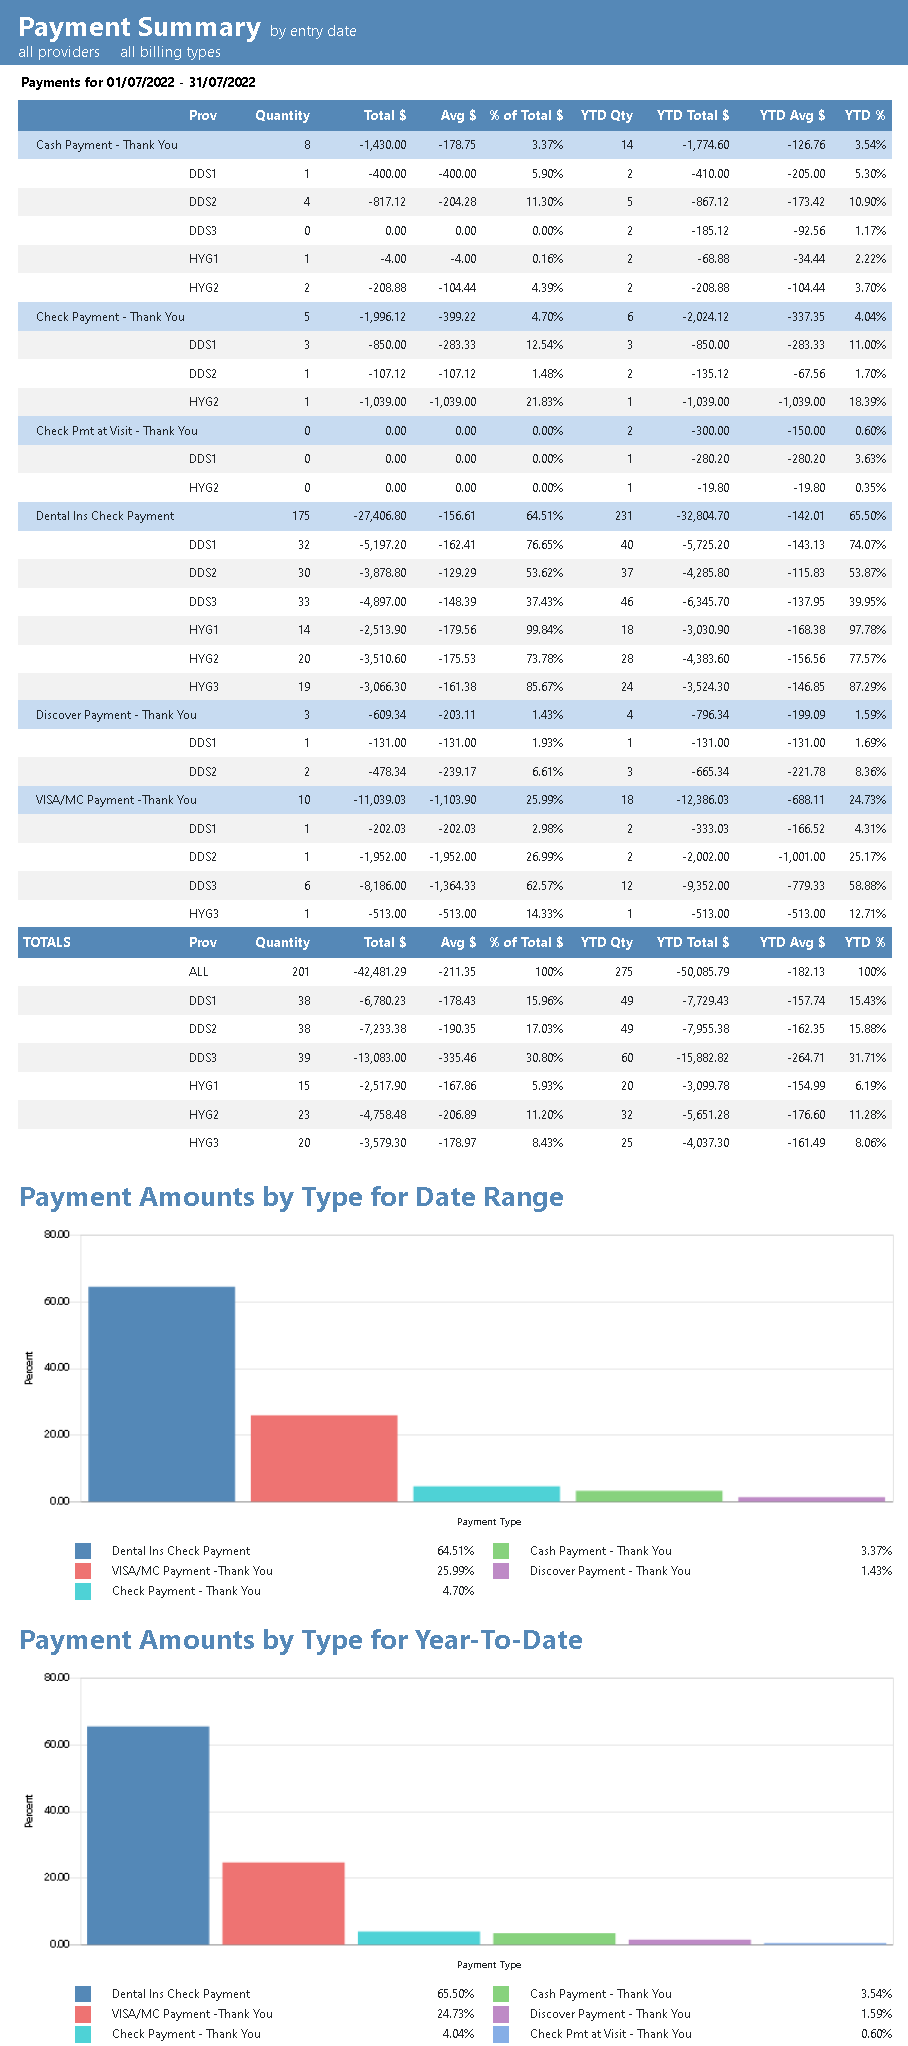
10. Payment Summary
The Payment Summary Report tallies the quantity, percentage, and total of payment types received during a date range. It subtotals each payment type by provider and can compare those numbers with your year-to-date totals. The graph compares the top ten payment types.
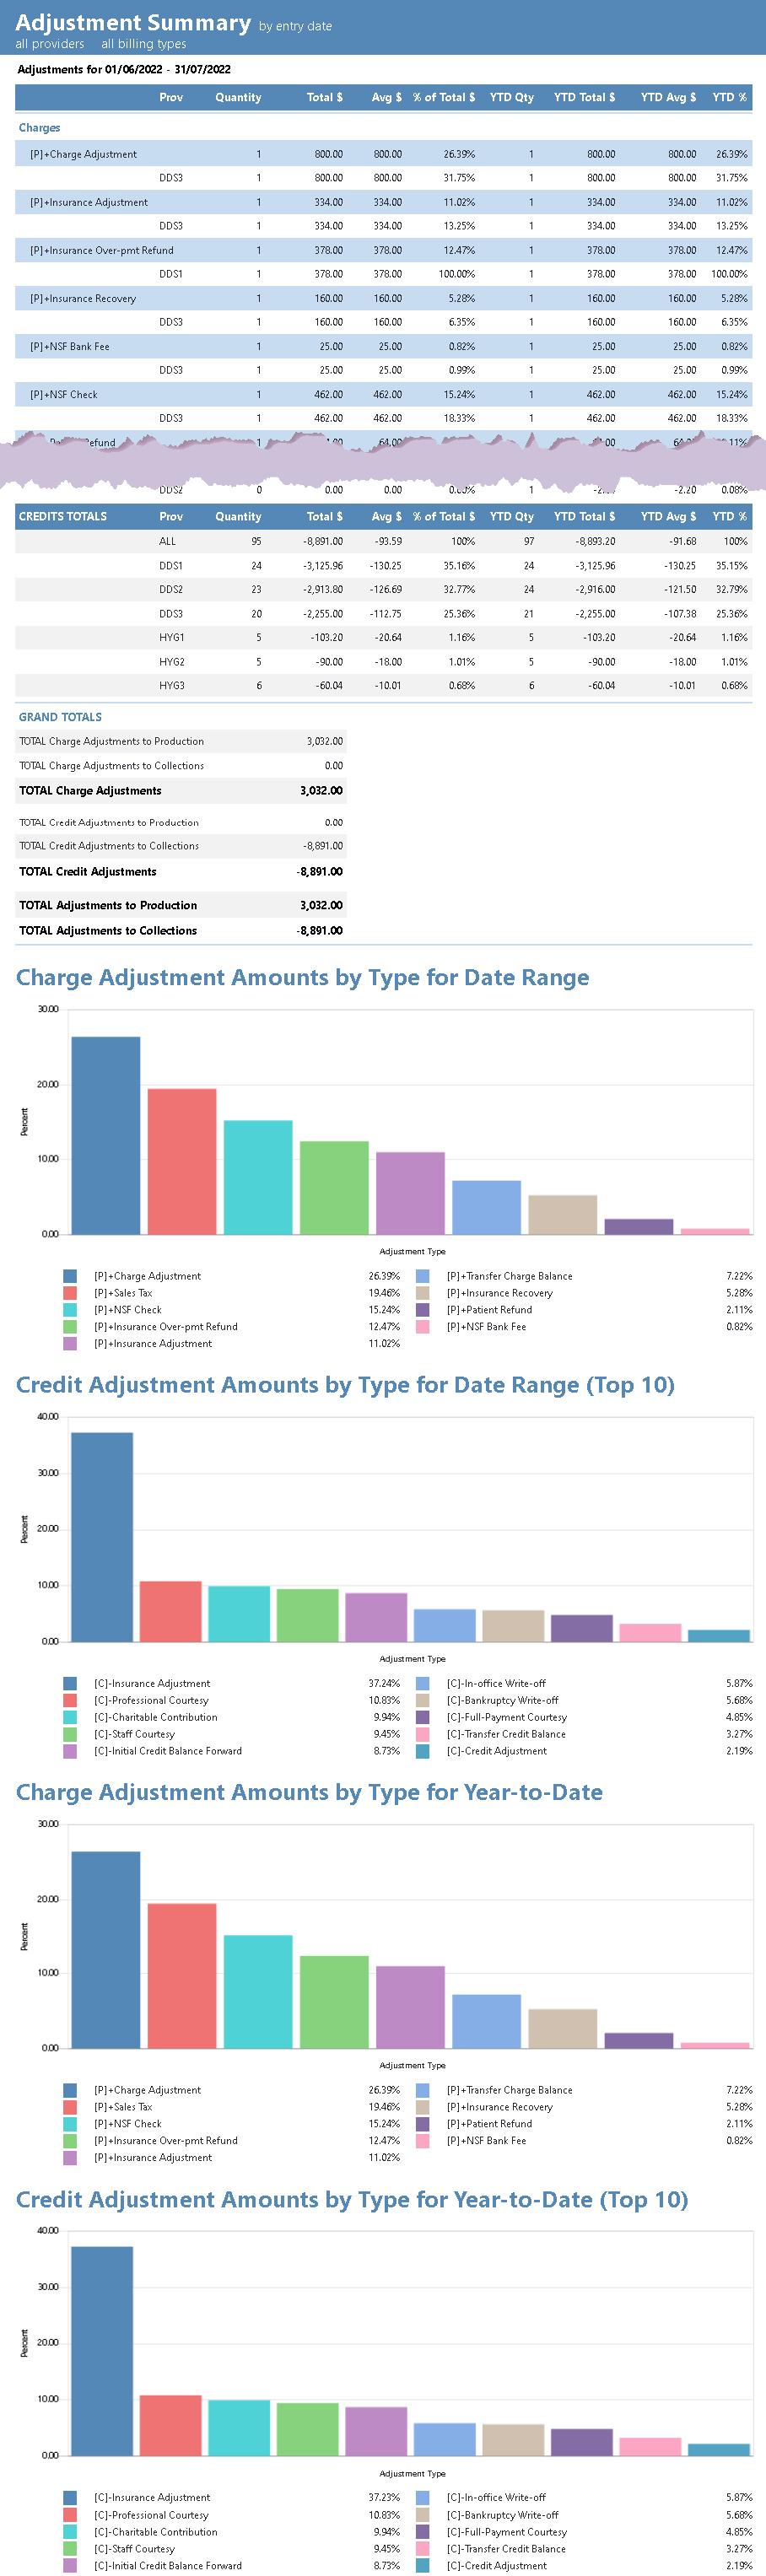
11. Adjustment Summary
The Adjustment Summary Report tallies the quantity, percentage, and total of adjustment types received during a date range. It subtotals each adjustment type by provider and can compare those numbers with your year-to-date totals. The graph compares the top ten adjustment types.
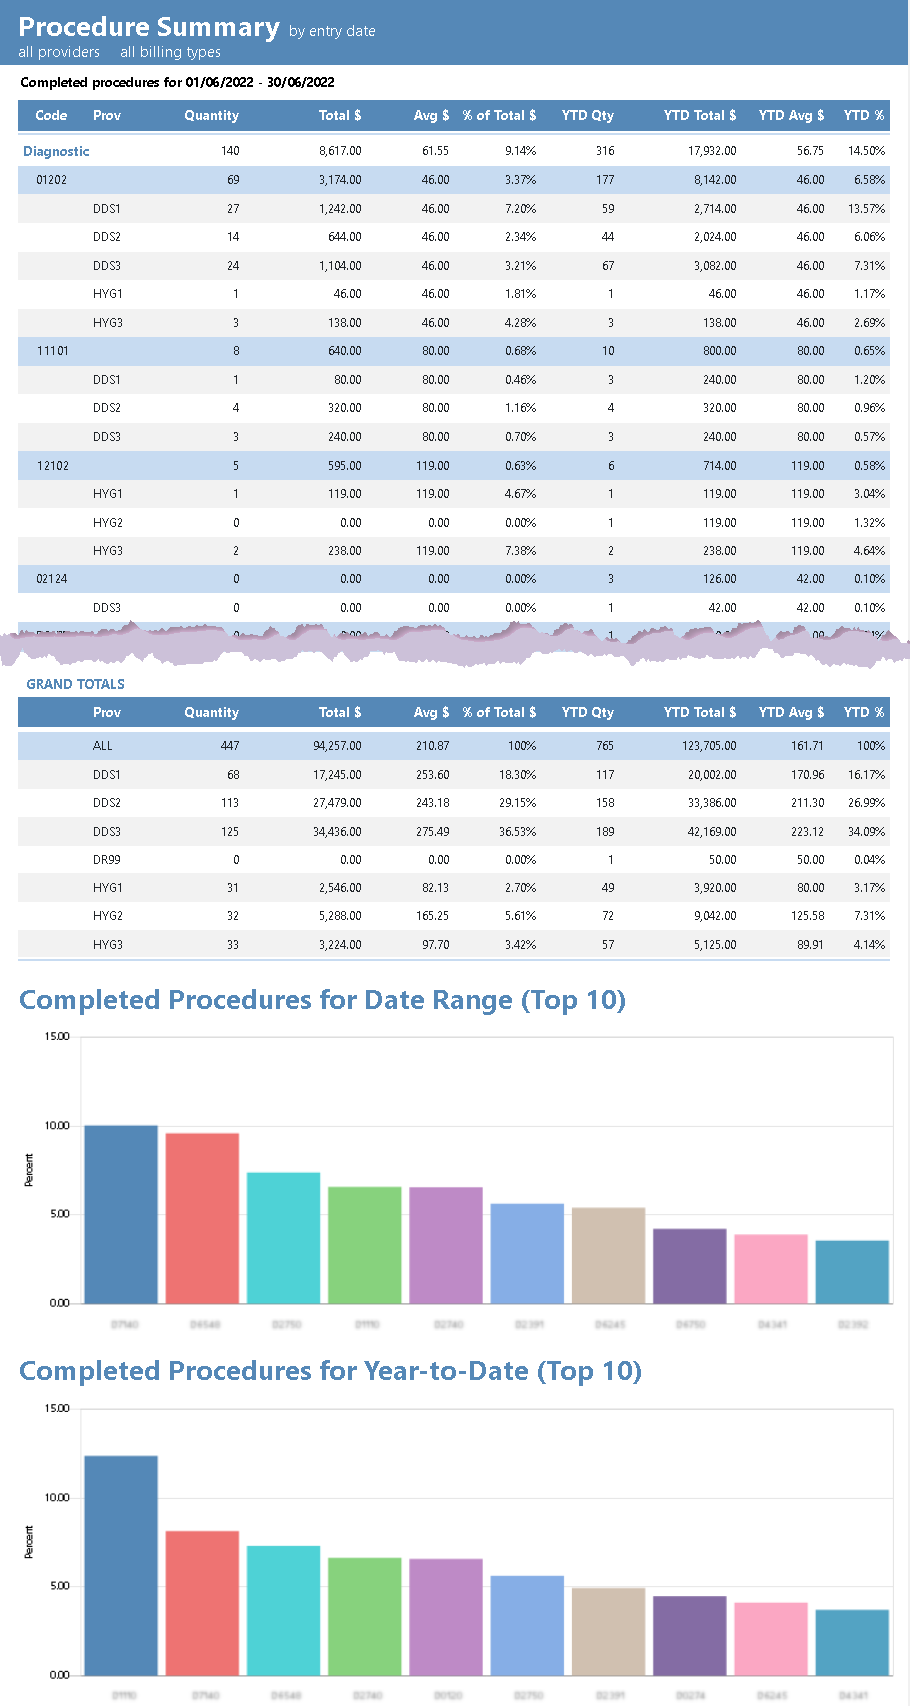
12. Procedure Summary
The Procedure Summary Report tallies the quantity, percentage, and total production of procedure codes entered during a date range. This report can display by procedure code categories or individual procedure codes. It can subtotal each code by provider and can compare those numbers with your year-to-date totals. The graph compares the top ten procedure codes used.
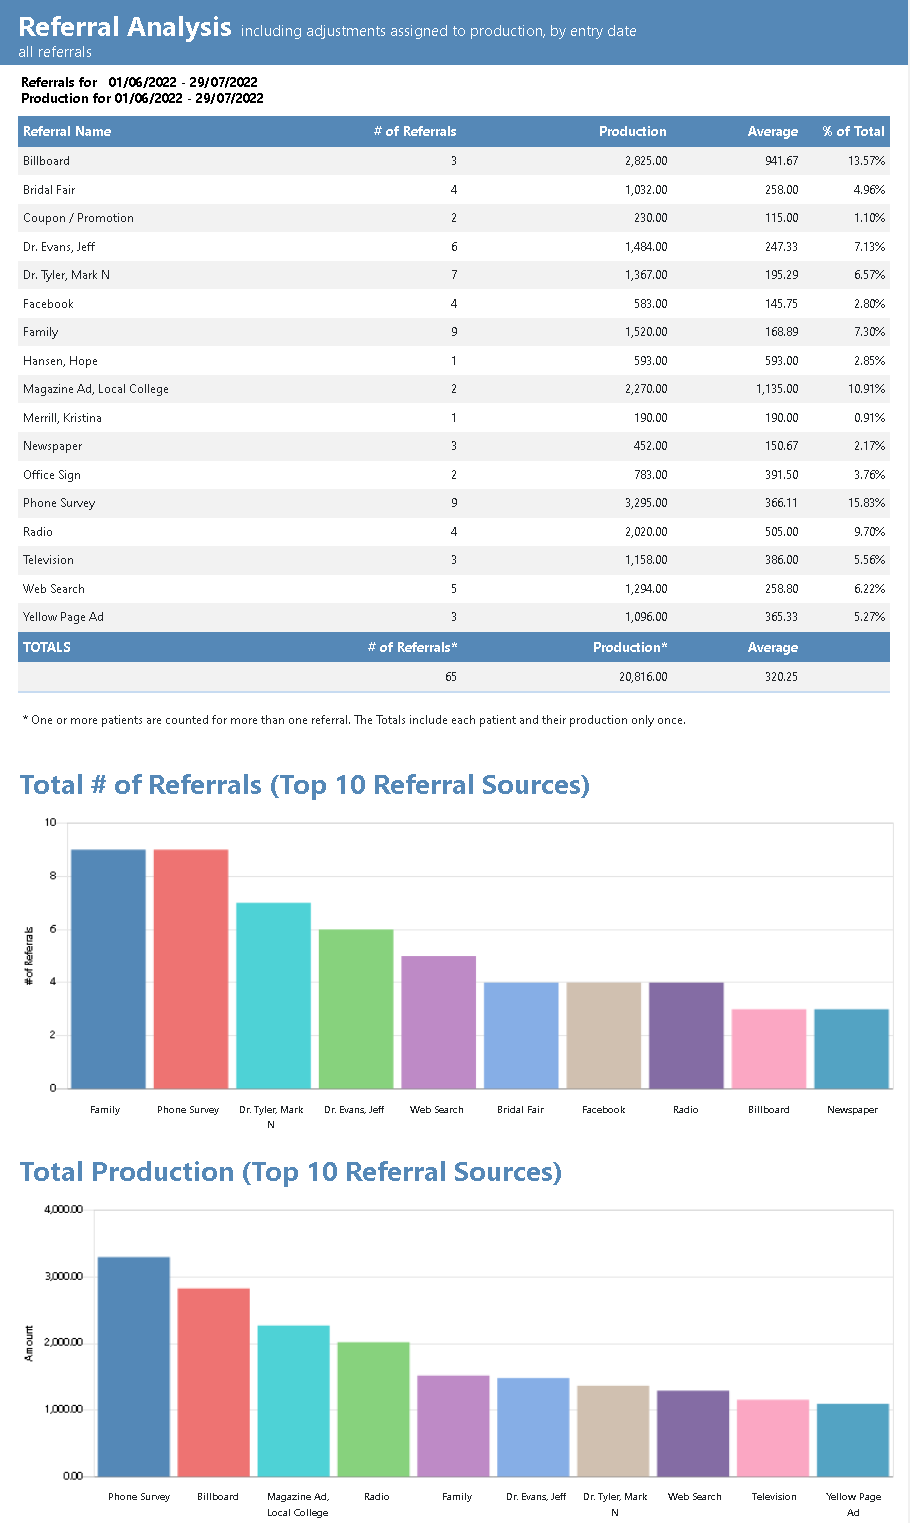
13. Referral Analysis
Find out which of your referral sources are most effective using the Referral Analysis Report. It provides totals of the number of referrals and the production generated from the referrals within the selected date range. You can view this information as numbers or as a bar graph.
The report options allow you to sort the report by Referral Name, Number of Referrals, or by production from highest to lowest so that you can view the information from those different perspectives.
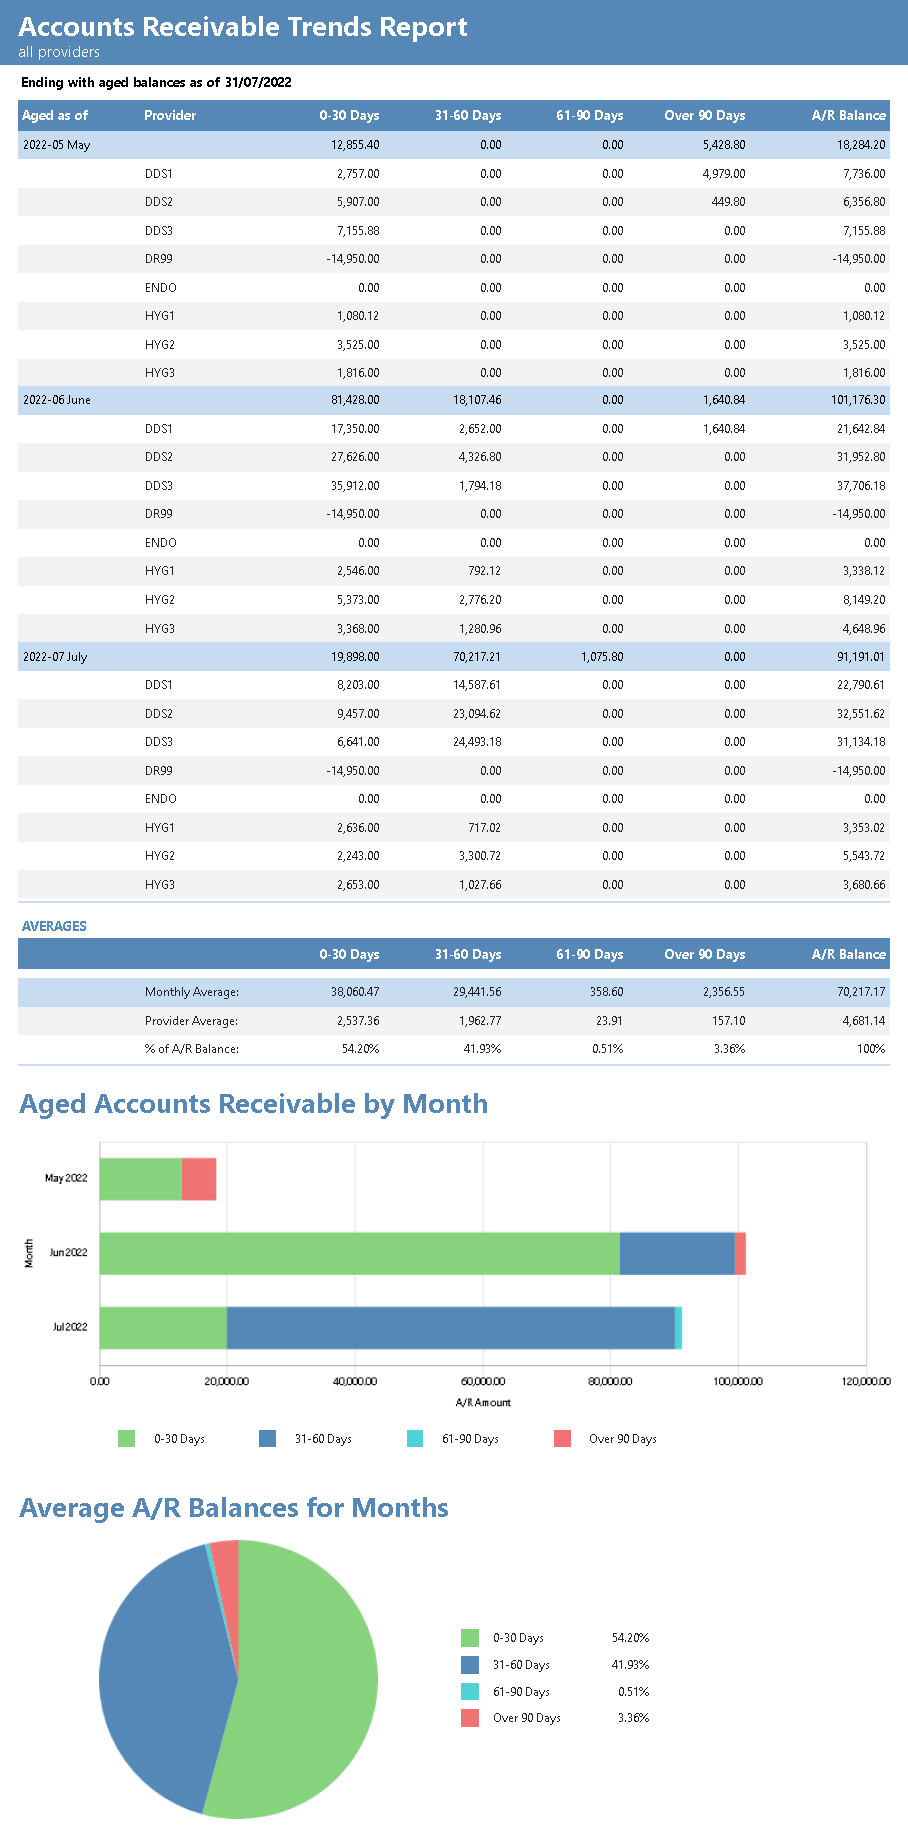
14. Accounts Receivable Trends
The Accounts Receivable Trends Report shows you if your office is trending better or worse in your efforts to collect payments. View what your accounts receivable looked like for several months at a time in both a numeric and graphical format. The receivables are displayed by month, provider, average, percentage, and total.
Conclusion
We’ve only scratched the surface of describing these reports and their value to your practice. Dentrix Reports are easy to read and provide valuable perspective about your practice in a simple and digestible format. You’ll be able to spot important trends and make informed business decisions to benefit your practice.
Learn More
For additional information, see the following:
- Read the various topics listed under Dentrix Reports Overview in Dentrix Help.
Other articles about Dentrix Reports:


